The Tygron Community Forum will be discontinued on March 6th 2026, matching the release of the 2026 version of the Tygron Platform.
Receive email notifications by changing your settings.
Click on your picture in the top right corner, go to Preferences and select your notification preferences.
Click on your picture in the top right corner, go to Preferences and select your notification preferences.
Thank you for contributing to our forum!
Please keep in mind:
1. To only comment on the topic where the discussion is about. Do you have a new question or topic? Please start a new discussion.
2. Be kind to other users!
Please keep in mind:
1. To only comment on the topic where the discussion is about. Do you have a new question or topic? Please start a new discussion.
2. Be kind to other users!
PET Overlay Abrupt Changes

Dear all,
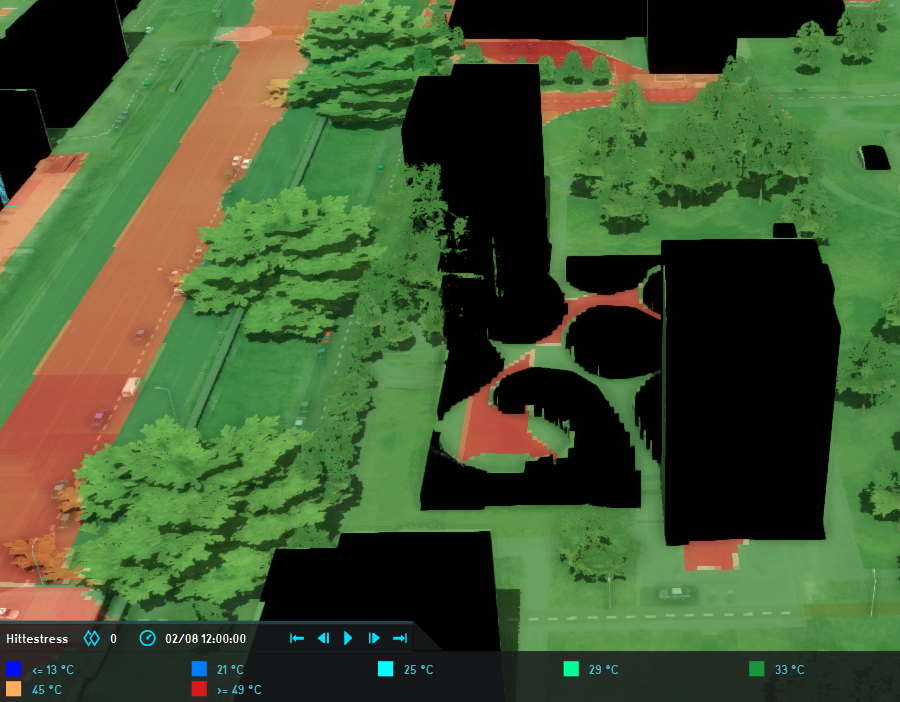
We want to carry out a heat stress analysis on a couple of flats in Amsterdam. However, the PET overlay results (default values) look very strange. There are very abrupt changes (34 degrees to 47 degrees in a few meters) in PET value without an identifiable reason. The patters of the higher PET values also seem very square. Could you help us identify the reason for these high PET values here?
The project is called staalmeesterslaan and the concerning building is the most northern of the appartment complexes. Please have a look at the screenshot of the situation below.
Kind regardss,
Glenn
Tagged:
Comments
Hi all,
In addition, we are experiencing a lot of difficulties to change the buildings in the middel to grassland. The buildings in the middel of this asset respresent a underground garage and are definitely not as high as in the default model. However, it is nearly impossible to change the function to grassland and to adjust the elevation of the model here.
Could somebody please help me? Thanks.
Kind regards,
Glenn
Hi @Glenn Morvan ,
I made a copy of your project and had a look.
Looking at the satellite picture, the area has some extreme elements, lots of concrete/ roadsurface flat areas in the full sun(hot), mixed with shaded areas (cool), so the differences in PET seem logical to me (with the disclaimer that I am not a heat stress specialist). The simulation starts at noon, which is already is the middle of a summer day, so that might have an influence too.
About the apartment block with the underground parking garage, I noticed that the parking garage is a section of the whole building (section 2). To have it properly underground, I removed the section from the building, added another, separate underground building, selected it as underground parking garage, and drew it in manually on the surface area of the whole block. The remaining open land can now be changed as terrain to Grassland.
I hope this is what you had in mind? In case you have further questions, please let us know.
Regards, Vincent
Thanks Vincent,
I overlooked the section of a building. Regarding the heat, still doesn't make sense to me, but I understand you're still investigating this part.
Thanks for your help already.
Kind regards,
Glenn
Hi Glenn,
I'd like to supplement Vincent's explanation with a bit of insight into the calculation's inner workings.
The Heat Stress Overlay calculates PET (Physiological Equivalent Temperature), which basically amount to a human perception of temperature, in an urban environment. A number of factors contribute to this. Among others, the following are of particular note:
You can imagine that if there's an ambient temperature of around 40 degrees celsius, and you stand in a wind-still location in the open sun, you will experience a lot of factors which make it feel hotter. When you step into the shade in a windy location, it will feel significantly cooler. The effect of shade is especially pronounced, as you will not directly experience the sun's radiance.
The default configuration for the Heat Stress Overlay is also set for august 2nd, 2013, which was a very very hot day. That makes the contrast all the greater.
The reason for the sharp edges in the PET results is because the calculation model requires foliage data to perform this calculation. The Tygron Platform does not automatically include foliage data, so instead the default approach is to extrapolate the foliage data from the presence of trees, which are loaded in as Buildings. This is described here:
https://support.tygron.com/wiki/Foliage_height_calculation_model_(Heat_Overlay)#Functions
Depending on the availability of data, sometimes trees are loaded in as individual entities but more often large swats of trees are loaded in as a single polygon (because that's how the data source has stored those trees). This means you sometimes get long polygons of locations where there are a couple of trees, but the Tygron Platform has no option but to interpret the entire polygon as a solid collection of trees. The way foliage is extrapolated from trees, this also means you get a rather smooth line of foliage around the location of trees.
You can get more insight into this by using the Heat Overlay's configuration wizard to include an overlay to visualize the foliage crown factor, which will indirectly demonstrate the exact polygons where trees are present, and the foliage result type, which will directly show where foliage is computed.
The exact formulas and models used are documented in a report by the Dutch RIVM, and can be found here: https://support.tygron.com/wiki/DPRA_Heat_stress_report
If you believe the effects require refinement, I have the following recommendations:
Use the Heat Stress Overlay's configuration wizard, and look at the available settings and configured (default) data. Overall, the complexity and amount of settings is not that much so for each step take a moment to see the available options, and use the question mark symbols or look them up on our support wiki if specific settings are unclear.
Change the date/time, and the associated weather data, so that a less extreme day is simulated. This will create a more day-to-day situation and as such more relatable results.
Please use the information found via the following page to obtain the relevant data:
https://support.tygron.com/wiki/KNMI_Weather_data
Load in your own foliage dataset, or otherwise refine the foliage used. You can either remove the existing trees and load in your own trees and tree heights as point data, or you can load in or compute a grid of foliage heights to be used instead. Follow the steps in the configuration wizard for this.
Also, please take a look at the Demo Heat Stress Project, in which an example is available for how to use infrared satellite imagery to estimate the presence of foliage. This may prove insightful for you.
Regards!
Rudolf
Sprawling spreadsheets so intricate Alexander the Great cuts them in half.
Thanks for the thorough explanation.
Intuitively for me, this does not completely explain the very sharp difference in temperature (>13 degrees(!)) in a location that does not have another function and no foliage that could possibly shade the surrounding areas. Must be in some other parameter. But thanks for now anyways, I will look into this in detail as soon as we get a follow up question from the client.
Kind regards,
Glenn