The Tygron Community Forum will be discontinued on March 6th 2026, matching the release of the 2026 version of the Tygron Platform.
Click on your picture in the top right corner, go to Preferences and select your notification preferences.
Please keep in mind:
1. To only comment on the topic where the discussion is about. Do you have a new question or topic? Please start a new discussion.
2. Be kind to other users!
Discharge overflows via (excel) indicator and excel export

[Original post was on wrong place, this one is correct]
Hi,
In short, is it possible (and if yes, how) to get an excel export, or only a graph, of the discharge of the overflows?
I'm currently working on a project where we are interested in getting the discharge of the different Overflows. The discharge by the sewer pump (Sewer_pump_speed) can be seen with the measurement tool after selecting the water overlay as a whole (see img_1), this discharge is correct and as expected. When selecting the Surface last value and then selecting it with the measuring tool a discharge is given (see img 2), which I assume is the Overflow. Which is then quite significantly higher than should be possible, the discharge by the overflow is set on 10m^3/s.
I could not see a TQL query which could help me out with this. Does anyone know how to get these numbers?
Thanks in advance!
Maarten
Img_1:
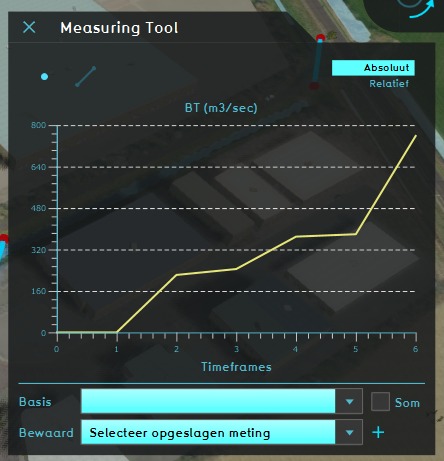
Img_2:

Comments
Hi Maarten,
any construction which has water flowing through it will have an OBJECT-FLOW-OUTPUT attribute, which will list the amount of water which has flowed through for each timestep. Using the measurement tool to produce the graphs you attached, it is actually those exact values which are displayed.
You can find more information about this attribute on our wiki:
https://support.tygron.com/wiki/Object_flow_output_(Water_Overlay)
Regards!