The Tygron Community Forum will be discontinued on March 6th 2026, matching the release of the 2026 version of the Tygron Platform.
Click on your picture in the top right corner, go to Preferences and select your notification preferences.
Please keep in mind:
1. To only comment on the topic where the discussion is about. Do you have a new question or topic? Please start a new discussion.
2. Be kind to other users!
How to create a Construction year overlay

On this forum are some topics about visualizing the construction year in an Overlay. With the new Combo Overlay it is possible to do this. Such an overlay can give insight into a neighborhood.
The construction year comes from the BAG (Basisregistratie Adressen en Gebouwen) data and is shown in the General tab of a building. This attribute is also displayed in the CONSTRUCTION FINISH DATE attribute. The construction finish date is the time in milliseconds relative to the (unix) epoch. If a building has a construction year from the BAG, the time in milliseconds from the epoch to the construction year is calculated, therefore it could be a negative number. Since the BAG is a Dutch dataset, the steps below are only for projects of a location in the Netherlands.
The steps to create the Construction year overlay:
- Add an Average Overlay which shows the CONSTRUCTION FINISH DATE attribute

- Add an Average overlay which shows the BAG ID attribute
- Add the Combo Overlay, in where the CONSTRUCTION FINISH DATE overlay is Grid A en the BAG ID overlay is Grid B.
- Then add the following formula to convert the construction finish date attribute to a human readable year: MUL(ROUND(ADD(DIV(DIV(A, 86400000), 365.25), 1970)), GT(B, 0))
- Change the legend to a more readable one for the map.
- Update the overlay if Auto Update is off.
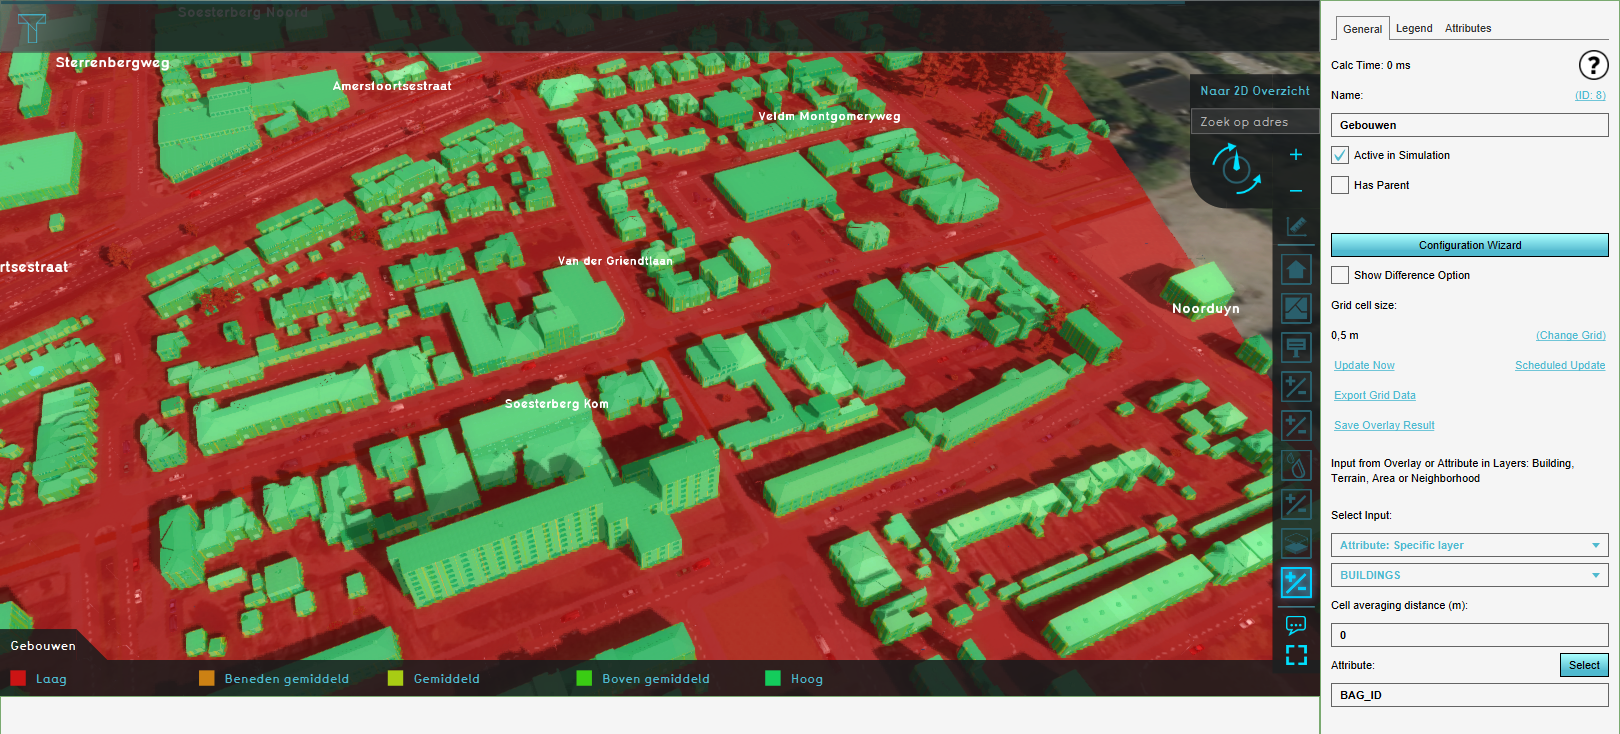
End result:

Tygron support team
Comments
Hey Godelief,
I liked your example, so I tried to create it as well. I do have some trouble with the legend. It like to change the legend with the API, but I askes for a id of the legend. "ID of entry which should be changed".
Also, is there a website or an overview somewhere, where I can find the color codes?
Hi Ward,
Nice to hear you are trying to recreate the example!
The entry in the event you are referring to is the number of the legend entry. This event (set_custom_overlay_legend_entry_color) is used to change a specific color of an already existing custom legend entry. I think that you can better use the
add_custom_gridoverlay_legend_entry
event. Here you can add the entries, colors and values for your overlay.
We don't have a list of the color codes on the Wiki, but you can also use RGB(A) values for the colors. See for more information: https://support.tygron.com/wiki/Color
I've also attached the legend with the color codes used for the map in this post.
Tygron support team