The Tygron Community Forum will be discontinued on March 6th 2026, matching the release of the 2026 version of the Tygron Platform.
Click on your picture in the top right corner, go to Preferences and select your notification preferences.
Please keep in mind:
1. To only comment on the topic where the discussion is about. Do you have a new question or topic? Please start a new discussion.
2. Be kind to other users!
A simple dashboard to extend built-in display options
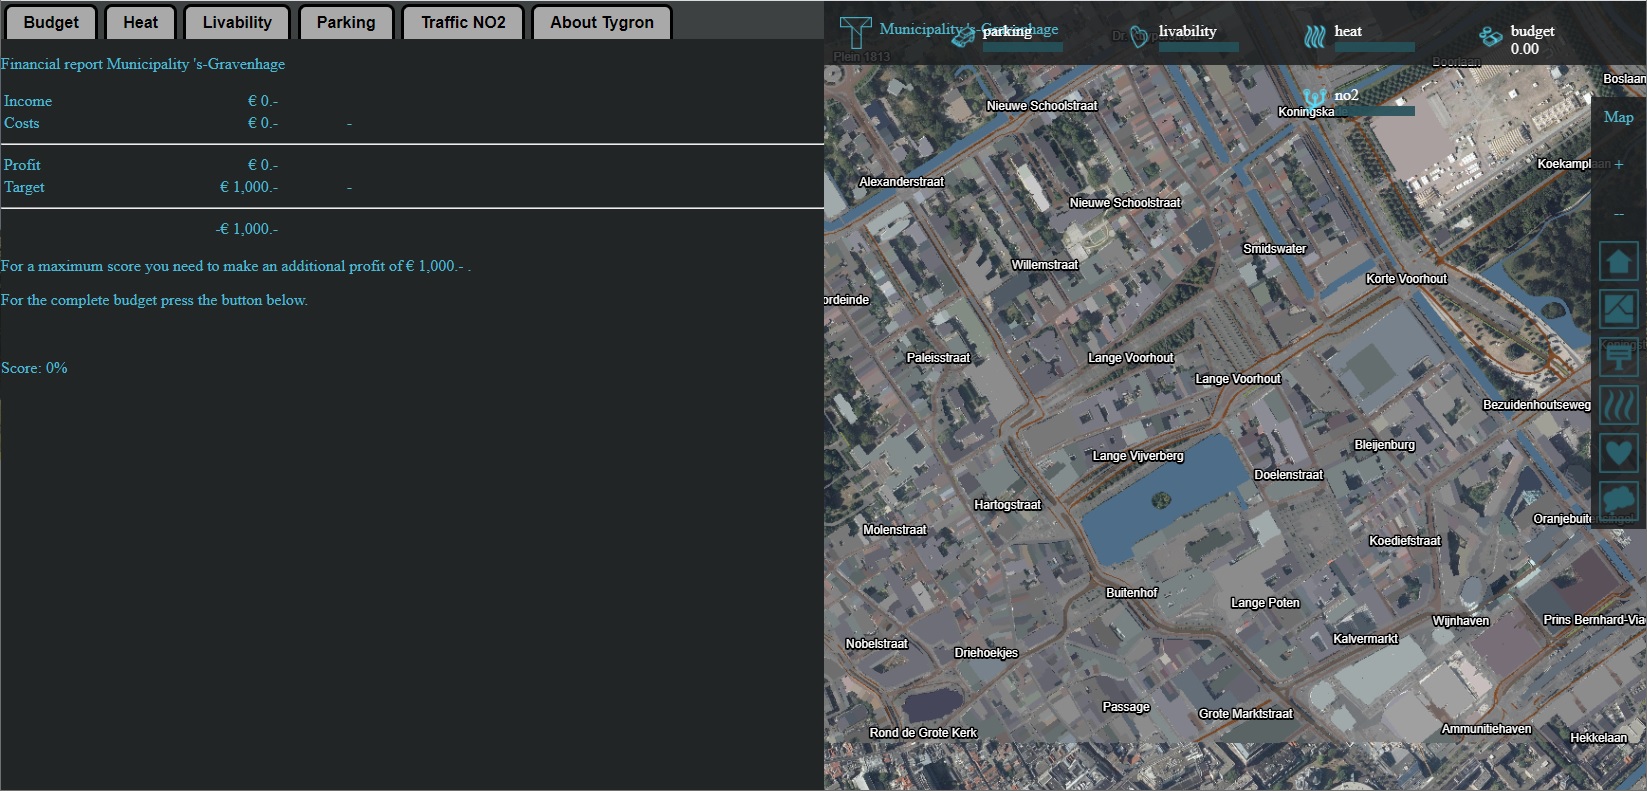
Working with the Tygron Platform provides a number of built-in tools to analyse data and provide results. Web panels, excel panels, and a 2D web viewer are all tools which are available to you. However, after trying them out for your first few use-cases, you may find a need for a bit more flexibility. Showing multiple views at the same time and in an integrated overview is often an initial step towards that flexibility.
One of the most common questions which keeps coming up among users is how to create an effective dashboard of information, which often has similar requirements but can vary in how their implementation can take place. As an inspiration and an initial starting point, I would like to share a simple dashboard I've created for a demo. It's written as pure HTML, CSS, and Javascript, meaning it can be placed directly in a text panel. The information it has to display can also be defined easily.
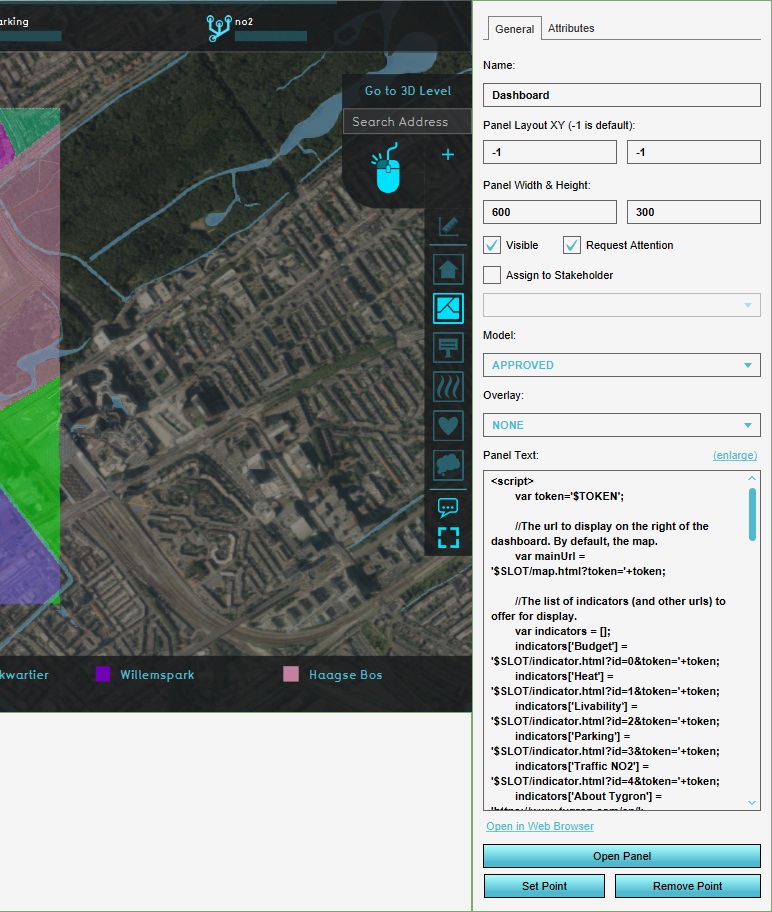
To use it, add a Single Panel, of type Text Panel, and paste the code in the panel. Open it, by selecting the panel in the editor, and selecting "Open in Web Browser".
The code starts with a list of indicators to display. You can add your own entries to display indicators by adding a line of the following format:
indicators=['NAME TO DISPLAY'] = $SLOT/indicator.html?id=ID OF INDICATOR&token='+token;
In which _NAME TO DISPLAY_ is the readable name for the selectable tabs, and _ID OF INDICATOR_ is the indicator's ID.
For example, to add a water storage indicator to the dashboard:
- Add a water storage indicator to your project.
- Select the indicator in the editor.
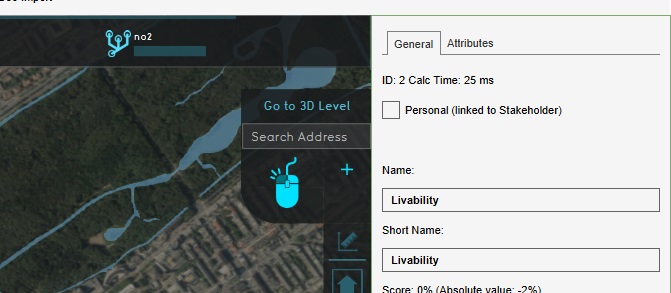
- At the top of the right panel, take note of the ID
- Open the dashboard panel in the editor, to edit its text
- In the list of indicators in the text of the dashboard panel, add a line with the following content: indicators=['NAME TO DISPLAY'] = $SLOT/indicator.html?id=ID OF INDICATOR&token='+token;
- Replace NAME TO DISPLAY with: Water Storage
- Replace ID OF INDICATOR with the ID determined earlier
- Reopen or reload the dashboard in the web browser
- The indicator can now be selected in the dashboard.
Other url's can also be added to the list of indicators, such as panels or urls of other websites. (However, note that some websites may reject being shown in a frame, preventing them from loading in the dashboard.)
The following is the code of the dashboard, and is also provided as an attachment. Copy it, and paste it in a Single Text Panel to get started:
<script>
var token='$TOKEN';
//The url to display on the right of the dashboard. By default, the map.
var mainUrl = '$SLOT/map.html?token='+token;
//The list of indicators (and other urls) to offer for display.
var indicators = [];
indicators['Budget'] = '$SLOT/indicator.html?id=0&token='+token;
indicators['Heat'] = '$SLOT/indicator.html?id=1&token='+token;
indicators['Livability'] = '$SLOT/indicator.html?id=2&token='+token;
indicators['Parking'] = '$SLOT/indicator.html?id=3&token='+token;
indicators['Traffic NO2'] = '$SLOT/indicator.html?id=4&token='+token;
indicators['About Tygron'] = 'https://www.tygron.com/en/';
</script>
<div style='display:flex;flex-direction:row;width:100%;height:100%'>
<!--The dashboard is split up into two sections: left and right-->
<div style='display:flex;flex-direction:column;flex-basis:1px;flex-grow:1;'>
<!--The left side consists of a list of tabs at the top to select an indicator, and an iframe at the bottom to display the selected indicator.-->
<div class='indicatorTabs' style='display:flex;flex-direction:row;'>
</div>
<div class='indicatorDisplay' style='height:100%'>
<iframe src=''></iframe>
</div>
</div>
<!--The right side consists of a single iframe, which will display the main url. By default, the map.-->
<div class='mainDisplay' style='flex-basis:1px;flex-grow:1;'>
<iframe src=''></iframe>
</div>
</div>
<!--For most elements, the styling is done inline. For the tabs, the styling is done via a class both to avoid duplicating the same rules, and to facilite a hover styling-->
<style>
.tab {
height: 2em;
line-height: 2em;
padding: 0em 1em;
border: 0.2em solid black;
border-radius: 0.5em 0.5em 0.0em 0.0em;
margin: 0.2em;
background-color: darkgrey;
color: black;
font-family: helvetica;
font-weight: bold;
border-bottom: 0px;
margin-bottom: 0px;
}
.tab:hover {
background-color: lightgrey;
}
</style>
<script>
$( window ).on('load', function(){
//For each indicator, create a tab
for (var indicator in indicators) {
var $tab = $('<div><span>'+indicator+'</span></div>').attr('data-url', indicators[indicator]).addClass('tab');
$('.indicatorTabs').append($tab);
}
//When the tab is clicked, display that indicator in the indicator display
$('.indicatorTabs').on('click', '[data-url]', function (event) {
$('.indicatorDisplay').find('iframe').attr('src', $(this).attr('data-url'));
});
//Apply the main url to the main display
$('.mainDisplay').find('iframe').attr('src', mainUrl);
//Pretend the first tab has been clicked to open the first indicator by default
$($('.indicatorTabs').children()[0]).trigger('click');
});
</script>
Sprawling spreadsheets so intricate Alexander the Great cuts them in half.


Comments
Also note that because you can display other indicators, panels, and sites in this dashboard, it's possible to rely fully on the computations, data, and styling of other parts of your project. If you enhance individual indicators with more advanced visualization, this dashboard can display those as well. For example, try and integrate the knowledge of this thread in your own indicator, and then display the results in this dashboard.
https://community.tygron.com/forum/discussion/comment/394#Comment_394
Sprawling spreadsheets so intricate Alexander the Great cuts them in half.
If you think this is interesting, you can also watch this video!! (Ducth only):
Kind regards,
Hansje
Tygron support team