The Tygron Community Forum will be discontinued on March 6th 2026, matching the release of the 2026 version of the Tygron Platform.
Click on your picture in the top right corner, go to Preferences and select your notification preferences.
Please keep in mind:
1. To only comment on the topic where the discussion is about. Do you have a new question or topic? Please start a new discussion.
2. Be kind to other users!
How to create a custom map to highlight data already present in the Platform

The generated 3D model in the Tygron Platform contains a lot of data, sourced from open data sources.
Not every bit of data that the model contains is already visualized in an overlay (map).
However, you can create your own map with the Attribute overlay and the Average overlay.
Below two examples of these overlays.
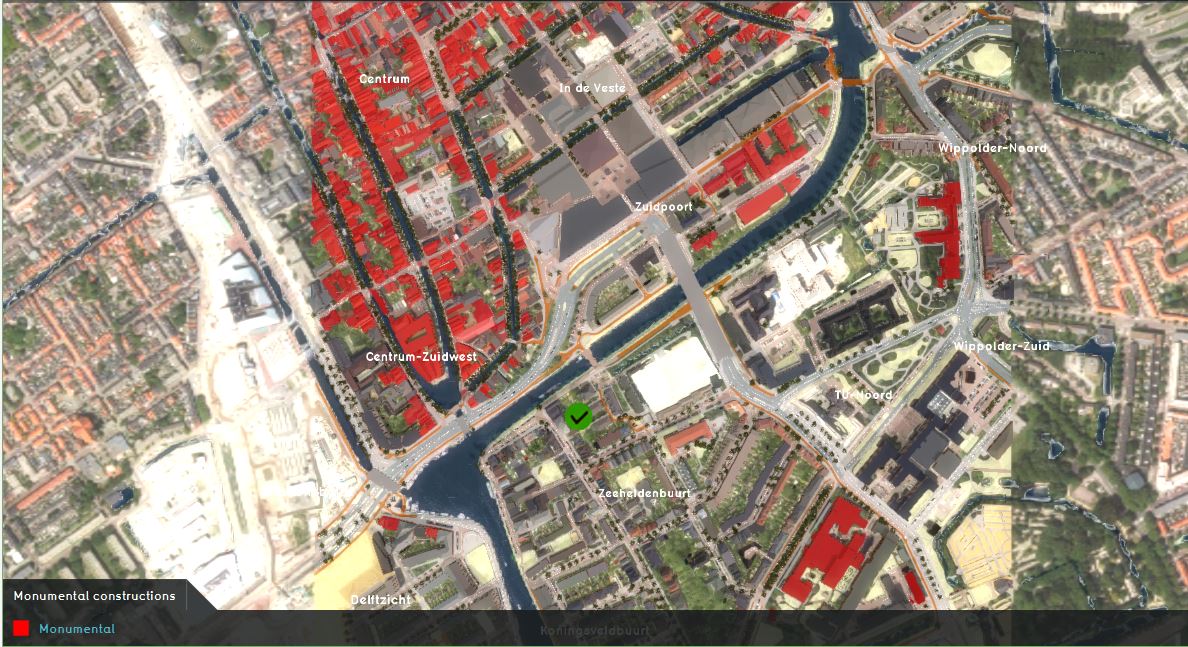
How to create a map of all monumental constructions
Constructions can have a monumental attribute set to 1 (monumental) or set to 0 (not monumental).
- In the Current tab, hover over Overlays and add the Attribute overlay
- Select the Attribute area overlay in the left panel
- In the right panel, change the name of the overlay to a fitting name for the map
- In the right panel, select as type the type of which the attribute belongs to. In this case, the Buildings
- Then for the filter, click on select and choose the MONUMENTAL attribute
Other maps that can be created from the Attribute overlay are for example:
- A map of all the buildings with a water storage function.
- A map of all the zones from the zoning plan that have Green as a destination.
In general, if you want to highlight the presence of a certain attribute, use the Attribute overlay.
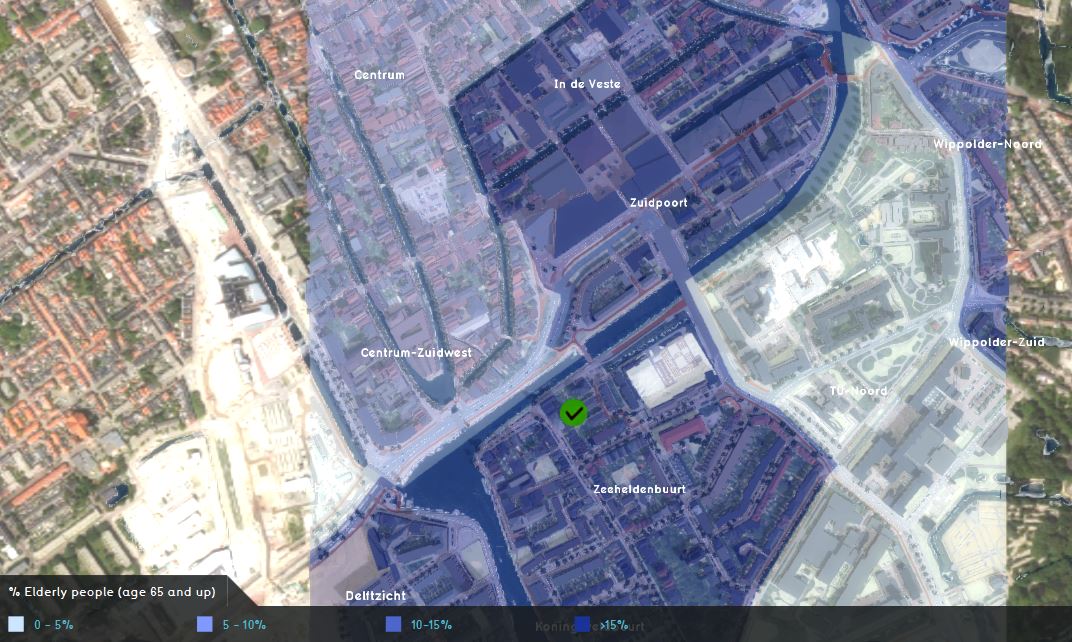
How to create a map of the % of elderly people (age 65 and up) per neighborhood
Each neighborhood contains statistics. For this example we visualise one of these statistical attributes.
- In the Current tab, hover over Overlays and add the Avg overlay
- Select the Average value overlay in the left panel
- In the right panel, change the name of the overlay to a fitting name for the map
- In the right panel, open the Configuration wizard
- In the wizard, choose the second option: gain insight into grid cell values
- In the wizard, select the attribute you want to visualize. In this example: PERCENTAGE_PERSONEN_65_JAAR_EN_OUDER
- In the wizard, choose the option Specific layer only and select the layer the attribute belongs to. In this case, the Neighborhoods.
- Finish the wizard and if auto update is turned off, recalculate the overlay. Tip: change the grid cell size to a smaller grid value to get a more accurate map.
- As a last step, change the legend of the overlay to creater a better readable map.
Other maps that can be created from the Average overlay are for example:
- The amount of water storage of constructions
- The amount of traffic flow (units per hour) on roads
In general, if you want to highlight the value of a certain attribute, add the Average overlay.
Do you know other maps to create with one of these overlays?
Tygron support team
Comments
Hey Godelief,
Great example. I tried to create an Attribute Overlay for the monuments in my map. But somehow there were none. So I tried another project, this time in Amsterdam, but again there where no buildings with an attribute Monumental set to 1.
Is this not data that is loaded into a Tygron-project, or am I doing something wrong?
Thank you
Hi @Ward van Laatum ,
Thanks, nice to hear you have tried the example! The monumental buildings data comes from Ruimtelijke plannen (zoning plan) data. By default the zoning plan is unchecked in the advanced options in the new project wizard. Therefore, to create this map, you have to check this option for the zoning plan when creating a new project. Let me know if this works for you now!
Tygron support team
Ah! Yes, that explains it. Thank you and thank you for your quick reply.