The Tygron Community Forum will be discontinued on March 6th 2026, matching the release of the 2026 version of the Tygron Platform.
Click on your picture in the top right corner, go to Preferences and select your notification preferences.
Please keep in mind:
1. To only comment on the topic where the discussion is about. Do you have a new question or topic? Please start a new discussion.
2. Be kind to other users!
JavaScript graphs & libraries in an indicator

A bit of JavaScript knowledge and a good understanding of indicators is recommended.
Did you know you can use JavaScript in your indicators?
This opens up a whole lot of possibilities!
Want to display your data on a pie-chart? JavaScript got you.
Want to call an API to do some calculations with your indicator data? JavaScript got you.
Want to funnel likes to your personal Twitter account? JavaScript got you.
Once you open up an indicator overview the EXPLANATION cell gets rendered as HTML which means we can also inject JavaScript. The possibilities are endless.
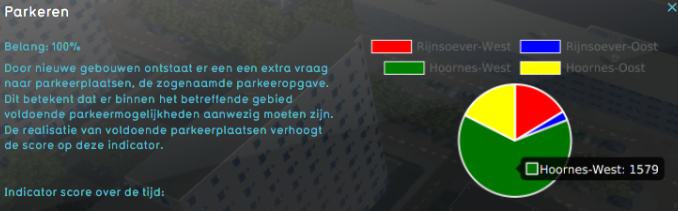
Pie-chart parking
In this tip I’ll be displaying the current parking from the parking indicator in a pie-chart.
You can get the parking indicator at: https://store.tygron.com
I'll be using the JavaScript Library Chart.js
Explanation Cell
Open up the indicator you just downloaded. In cell B1 you can see a whole bunch of HTML being appended to create a table of the indicators data. For simplicity of this tip we’ll not be editing the existing HTML but creating our own one.
- Empty cell B1
Chart.js & Data cells
The indicator now has no HTML output whatsoever so we have to create our own.
For this create 4 cells
- Chart Dom (B18)
- Chart Data init (B19)
- Chart Data load (B20)
- Chart render (B21)
Chart Dom contains the code to load the Charts.js library and create the DOM element it will render the pie-chart in.
Code B18:
<script src="https://cdnjs.cloudflare.com/ajax/libs/Chart.js/2.8.0/Chart.bundle.js"></script>
<canvas id="chart">
</canvas>
Chart Data init contains the code which creates the initial arrays that will be filled with data and the colors that will be used by the pie-chart
Code B19:
<script>
var data = {
datasets: [{
data:[],
backgroundColor: ['red', 'blue', 'green', 'yellow']
}],
labels: []
};
</script>
Chart Data load contains a formula which concatenates dynamically created code based on parking labels & amount.
Formula B20:
="<script>"&CONCAT(AJ8:AJ48)&"</script>"
Chart Render contains the code which actually renders the pie-chart to the DOM
Code B21:
<script>
var ctx = document.getElementById('chart');
var myPieChart = new Chart(ctx, {
type: 'pie',
data: data
});
</script>
For more information on how to use charts.js see their documentation.
Getting the parking amount and labels
At Chart Data load I mentioned cells AJ8 to AJ48 these are the cells that become some code that will push the values of a row to our data array. This formula is copied down with the handy Ctrl + drag functionality.
Formula in AJ8:
=IF(Y8="","","data.datasets[0].data.push("&AA8&");"&"data.labels.push('\"&Y8&"');")
The Formula checks if we have a name at Y8 if we don't AJ8 will stay empty if we do we fill the cell with:
data.datasets[0].data.push(AA8); data.labels.push(Y8)
AA8 is the current amount of parking and Y8 is the name of the neighborhood. The ",&,\ characters are used in the formula to concatenate and escape values.
Putting it all together
If you've filled in all the Cells as described above you can now concatenate B18, B19, B20 and B21 in the EXPLANATION cell(B1)
Formula B1:
=CONCAT(B18:B21)
Tips & notes
Tips:
- Write JavaScript in a proper text-editor then copy it into your sheet
- Are things not working as expected open up the indicator in your browser. Hit F12 and checkout the console tab. This might give some useful error messages
Notes:
- See the indicator attached as example.
- This is not an exhaustive guide to web development and not tested above 4 neighborhoods and every screen size. See it as an conceptual introduction to how you could use libraries & JavaScript in your indicators!
- Thanks to @Boing & @Ward for inspiring this tip!