Click on your picture in the top right corner, go to Preferences and select your notification preferences.
Water Overlay Difference Export

Hi,
I have a relatively simple model of a shopping mall that I use to calculate water depths after an event and to calculate the effects of potential measures.
First measure I implement is a set of 'waterdoorlatende wegen' with a storage capacity of 0,14. The outputs of the 'normal' overlay with absolute values for both the reference situation and the situation with measures look fine (no real change due to these measures really, figure 2 and 3). However, the difference map looks very odd and shows large differences (both lowered as increase in water depth). Doesn't look really reliable.
Do you guys maybe have an idea what's going on here?
I have opened the project for support. Please contact me personally for the name of the project.
Kind regards,
Glenn

Comments
Hi Glenn,
I recommend running the calculation and looking at the water balance of the water overlay after the calculation completes.
In addition, if you want to see in greater detail exactly where any potential differences are computed, you can use a difference overlay. This overlay comes with a default "difference legend". You can modify this legend so that it colors more quickly, even for smaller amounts of difference. Normally, a color is given for 1cm of difference, but this can be changed to, for example, less than 1mm. You can then investigate those locations and see how much difference has truely been computed.
Regards!
Sprawling spreadsheets so intricate Alexander the Great cuts them in half.
Hi Rudolf,
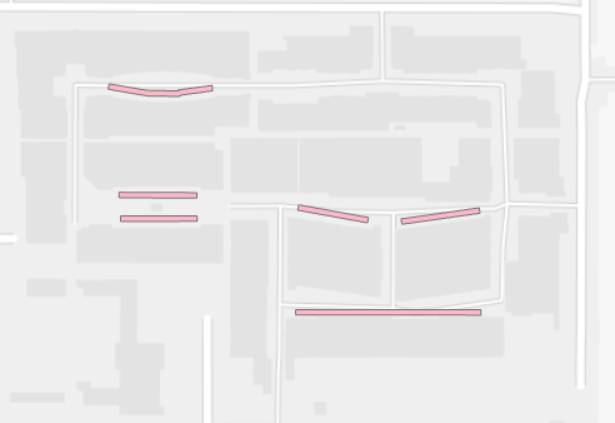
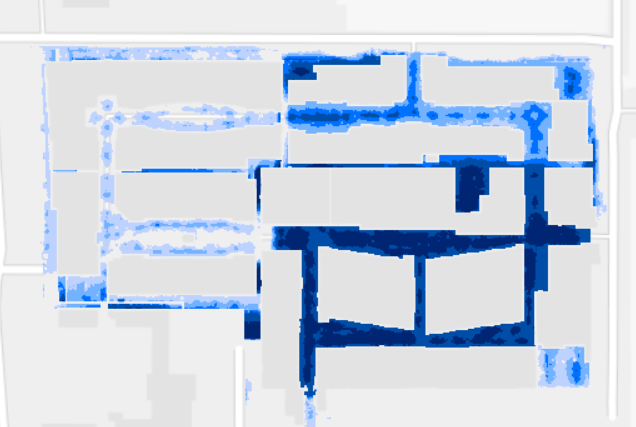
Thanks for your response. I know about the difference overlay, that was the point of my question. But I see I forgot to make my point with a screendump of the strange looking Difference Overlay. Please find the strange difference overlay below. Any idea what might cause these patterns?
Kind regards,
Glenn
In tygron the difference overlay looks more reliable by the way (screendump below). It seems there is only a problem with the output (or with my postprocessing).
In addition to the above, I now divided the raster output by 10 (no idea why, but worth the try) and I got a better result then previously (see figure above). However, the increase in water depth in the top left is still inexplicable since there were only measures implemented that increase water storage under ground.
Can you please have a look? We need to deliver within a couple of weeks.
Kind regards,
Glenn